For Immobilization and Subsequent Kinetic Characterization of Mouse IgGs and other Fc-Containing Proteins
Anti-Mouse IgG Fc Capture (AMC) biosensors enable kinetic characterization of macromolecular interactions between mouse Fc-containing proteins and target analytes. Immobilization of mouse Fc-containing proteins is achieved through a factory immobilized anti-mouse Fc-specific antibody whose high-affinity for the mouse Fc domain provides the stable baseline required for demanding kinetics applications. AMC biosensors can be regenerated up to 10 times via a standard low-pH protocol in as little as two minutes for select applications.
Learn More:
Key Applications
AMC biosensors provide a flexible platform for evaluating the kinetics between mouse Fc-containing proteins and their analytes.
- Complete kinetic analysis (kon, kdis and KD) between mouse Fc-containing proteins and target analytes
- Off-rate ranking of hybridoma and stable cell-line supernatants
- Epitope binning/mapping (from crude or purified samples)
- Tracking product integrity by measuring kon, kdis and KD during:
- Upstream fermentation
- Downstream harvest and purification
- Post-derivization (pegylation)

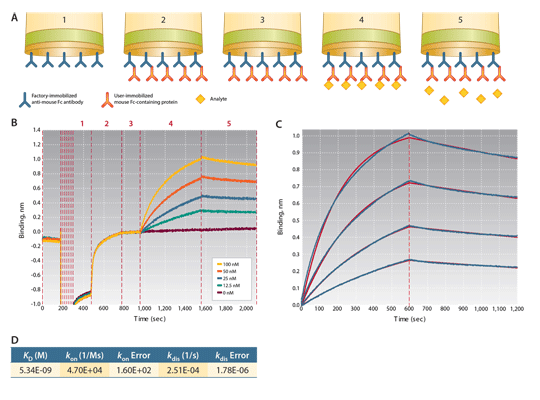
Figure 1: Kinetic characterization of the interaction between a mouse IgG1 antibody and a FAb analyte at 4 different concentrations using AMC biosensors. After an equilibration step and a preconditioning cycle, the assay consists of 5 assay steps. Step 1: equilibration, Step 2: loading (capture) of mouse IgG1, Step 3: baseline, Step 4: association kinetics, Step 5: dissociation kinetics. The raw data for a full assay is shown in Figure 1B. After data processing (including reference subtraction using the 0 nM trace), the association and dissociation traces were fit to a 1:1 binding model (1C, red lines). Values of KD , konand kdis were extracted from the curve fitting analysis (1D).
For More Information
Visit our literature page to download technical notes, application notes, posters and customer presentations.